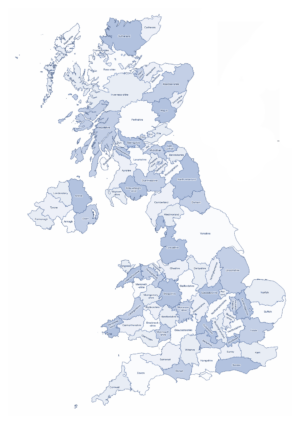
UK Buy-to-Let locations | finding the right buy-to-let mortgage adviser can make a significant difference to your investment decisions. Connect Experts helps landlords and property investors find buy-to-let mortgage advisers across the UK based on location, experience, and specialism.
Property investment in 2025 is increasingly competitive and more complex for landlords. Identifying the best UK buy-to-let locations is no longer about choosing a single popular city. It requires balancing rental yields, long-term capital growth, and sustained tenant demand in a changing market. Working with buy-to-let mortgage advisers can help investors assess opportunities more accurately based on location and lender criteria.
Rising interest rates, tighter affordability assessments, and ongoing changes to rental regulation have reshaped the buy-to-let landscape. Many landlords now rely on buy-to-let mortgage advice to navigate lending rules while protecting portfolio performance. Despite these challenges, strong opportunities remain in areas where housing supply is limited and rental demand continues to exceed availability. Local insight from UK mortgage advisers can be particularly valuable when assessing these markets.
Top buy-to-let hotspots in 2025, highlighting regions with strong rental yields and long-term growth potential, supported by local mortgage advisers in London and other high-demand locations.
Key market trends, including how tenant preferences are changing due to affordability pressures, flexible working patterns, and regeneration activity across UK towns and cities.
Regional performance insights, explaining why certain locations continue to outperform others for rental income and capital appreciation, based on lender appetite and tenant demand.
Portfolio planning strategies for landlords, including refinancing options, portfolio diversification, and ownership structures, are supported by experienced buy-to-let mortgage advisers near you.
All guidance should be considered alongside advice from FCA authorised mortgage advisers, who can assess your personal circumstances and investment goals before you proceed.
Top UK Regions by Rental Yield (Useful Data for Investors)
Fleet Mortgages data from Q2 2025 reports the UK’s average rental yield at 7.5%. Some areas exceed this figure:
| Region | Avg Rental Yield Q2 2025 | Trend vs Q2 2024 |
|---|---|---|
| Wales | ~9.0% | Up from ~8.3% |
| North West | ~8.8% | Slight increase |
| North East | ~8.7% | Small decrease |
| Greater London | ~6.0% | Flat or slightly down |
| South East | ~6.5% | Stable |
Regions such as Wales and the North West continue to show strong returns. These areas often have lower entry prices and robust tenant demand. London, in contrast, remains more expensive to enter, reducing yield despite higher rent levels.


Cities & UK Hotspots Where Yield Is Strong (Actionable Guidance)
According to Zoopla’s 2025 analysis, these cities offer high gross yields:
| City | Avg Gross Yield | Monthly Rent | Property Price |
|---|---|---|---|
| Sunderland | ~9.3% | ~£659 | ~£84,900 |
| Aberdeen | ~8.3% | ~£734 | ~£106,200 |
| Burnley | ~8.2% | ~£634 | ~£92,500 |
| Glasgow | ~7.8% | ~£1,012 | ~£154,900 |
| Liverpool | ~7.7% | ~£870 | ~£136,000 |
These locations have lower purchase costs, but benefit from strong rental demand. This creates favourable conditions for cash flow, especially when compared with southern England or London.
London Boroughs: Where Yields Still Make Sense in The Capital
Although average yields across London remain below the UK average, some boroughs still offer stronger potential returns:
Barking & Dagenham (~5.7%) – Supported by regeneration and better transport.
Newham (~5.5%) – Driven by new developments and strong rental demand.
Lewisham (~5.2%) – More affordable, with good connectivity and steady tenant demand.
Croydon (~5.0%) – Attracts tenants due to redevelopment and commuter links.
By contrast, Prime Central London areas typically yield between 2.5% and 3.0%, making them less attractive for income-focused landlords.
What Is a “Good” Rental Yield in 2025?
Yield targets have shifted due to higher borrowing costs and increased regulation. Here’s a benchmark based on 2025 figures:
UK average gross yield: ~5.8%
Average rent: ~£1,301 per month
Average property price: ~£270,000
Regions like the North West, North East, and Wales regularly achieve 7% to 8% gross yields. In London, average yields are ~4.3%, although outer boroughs can offer closer to 5.5% to 6%.
For most landlords, a gross yield between 6% and 8% represents a strong target. In London, 4.5% to 6% may be considered healthy depending on property price and running costs.
How to Calculate Yield & What Can Eat into Your Returns
Understanding how to calculate both gross and net yields is essential. The formulas are:
Gross yield = (Annual rent ÷ Purchase price) × 100
Net yield = [(Annual rent – Annual costs) ÷ Purchase price] × 100
Typical costs include:
Mortgage repayments
Insurance
Letting agent fees
Repairs and maintenance
Voids (periods without a tenant)
EPC and safety compliance
Local council licensing
Example Calculation:
Purchase price: £250,000
Rent: £1,500 per month (£18,000 annually)
Annual costs: £4,500
Gross yield: (18,000 ÷ 250,000) × 100 = 7.2%
Net yield: (13,500 ÷ 250,000) × 100 = 5.4%
This highlights why net yield gives a more accurate picture of return after costs.
How Connect Mortgages Supports Portfolio Landlords (360° Review)
Connect Mortgages provides more than just mortgage sourcing. For landlords with multiple properties, we offer a full review covering:
Performance analysis across the portfolio
Comparison of current vs. available mortgage deals
Yield reviews to highlight income loss or inefficiencies
Recommendations on refinancing, restructuring, or selling assets
Planning for new rules such as EPC changes, licensing, or tax reform
This service helps landlords manage their portfolios effectively and maintain profitability.
Choosing Strong Buy-to-Let Locations in 2025
Success in buy-to-let depends on more than just headline rental yields. You should also consider:
Property price vs. achievable rent
Local rental demand from students, workers, and families
Ongoing costs, including finance, insurance, and repairs
Infrastructure, regeneration, and transport improvements
True net return after deductions
High-yield areas in the North, Scotland, and Wales offer attractive returns. Outer London boroughs may also offer decent yields if priced correctly. Central London areas may suit those seeking long-term capital growth but come with lower income yields.
If you’d like help reviewing your portfolio or comparing current mortgage deals, Connect Mortgages can provide a free portfolio review.


Browse our Buy-to-Let Brokers
Inspired by Similar Search Results
FAQ: UK Buy-to-Let Locations
| Question | Answer |
|---|---|
| Which UK cities balance yield and growth best right now? | Birmingham, Manchester, and Leeds often strike the best balance. They offer stronger yields than prime London while benefiting from regeneration and strong job markets. |
| Where can I still find strong yields? | Liverpool, Nottingham, and parts of Sheffield and Newcastle provide competitive yields. Focus on areas with proven rental demand and always check Article 4 directions for HMOs. |
| Is London still worth it for buy to let? | Yes, particularly for long-term capital growth and exit potential. Zones 3 to 6 often offer better rental yields compared with central London. |
| Which locations suit first-time landlords? | Cities like Birmingham, Leeds, Bristol, and Cardiff suit newcomers due to stable rental demand and accessible entry prices. Opt for simple, well-located flats or small houses near transport links. |
| What about student lets? | Liverpool, Nottingham, Sheffield, Manchester, Leeds, and Newcastle all have large student markets. Review local licensing, Article 4 restrictions, and plan for void periods between academic terms. |
| How do local rules affect my plan? | Regulations such as HMO licensing and selective licensing vary by council. Always confirm the current requirements for the specific street or postcode, not just the wider city. |
| Should I buy new build or period stock? | New builds offer lower maintenance costs and strong EPC ratings, while period terraces can provide higher yields and renovation potential. Match the property type to your tenant profile and budget. |
| How do I compare micro-locations within a city? | Evaluate proximity to transport, major employers, universities, hospitals, and amenities. Review historic voids and average rents for the exact street and property type. |
| What is the best way to reduce risk? | Stress test your figures at higher interest rates, keep a repair buffer, use reputable letting agents, and diversify across multiple cities if your budget allows. |
| How does Scotland or Northern Ireland differ? | Letting legislation, notice periods, and processes differ from England and Wales. Always seek local legal guidance and work with advisers experienced in those regions. |


